Biocycle Nationwide Survey: Residential Food Waste Collection in the United States. Part II
Photos: courtesy of City of Minneapolis and the Solid Waste Authority of Central Ohio.
by Nora Goldstein, Paula Luu and Stephanie Motta
The number of households in the U.S. with access to food waste collection grew by 49% since 2021 — from 10.0 million to 14.9 million.
The following article “Biocycle Nationwide Survey: Residential Food Waste Collection in the United States” by Nora Goldstein, Paula Luu, and Stephanie Motta appeared originally in Biocycle on September 11, 2023 and is reposted here with permission. See the following links for other articles in the series.
Part I
Full-Scale Food Waste Composting Infrastructure In The U.S.
Part III
Best Opportunities To Upgrade Yard Trimmings Composting Facilities To Scale Food Waste Diversion
The 2023 BioCycle Residential Food Waste Collection Access Study (Access Study) reports on households in the United States that have access, via curbside collection and/or drop-off, to food waste collection via their local government (municipally supported). From February to June 2023, BioCycle surveyed cities, towns, counties, and solid waste authorities to learn more about their food waste collection programs. BioCycle last conducted its nationwide residential food waste collection access survey in 2021.
Municipally supported collection programs (curbside and drop-off) are offered by local governments directly or by private haulers under local government contract or agreement. BioCycle divided these residential food waste collection programs into three categories: Curbside only; Drop-Off only; and Curbside+Drop-Off. The third category, Curbside+Drop-Off, avoids double counting jurisdictions when a program offers both.
BioCycle received support from the Composting Consortium, a multi-year industry collaboration managed by the Center for the Circular Economy at Closed Loop Partners, to conduct its nationwide survey of residential food waste collection access programs in the U.S. Survey data collection and analysis has been supported by Stephanie Motta. Part I of this article series, “Full-Scale Food Waste Composting Infrastructure in the U.S.” also was supported by the Composting Consortium. Parts III and IV will report on findings from separate Composting Consortium projects — one that analyzed state regulations for upgrading composting sites that currently handle yard trimmings to also accept food waste, and another focused on anaerobic digestion of compostable packaging.
Methodology
Similar to the 2017 and 2021 BioCycle Nationwide Access Studies, an online survey questionnaire was created. A link to the survey, along with instructions, was sent to BioCycle’s contact list of 375 cities, counties and solid waste authorities that were identified as having municipally supported residential food waste collection programs. A total of 85 programs completed the online survey form (a 23% response rate); in 2021, the response rate was 64%. This lower response rate in 2023 does not impact BioCycle’s overall quantitative Access Study findings, however it does limit qualitative findings, e.g., responses to questions about program successes and pain points, effective outreach and education strategies to boost participation and reduce contamination, among others.
The findings in the 2023 BioCycle Access Study are based on the online survey responses, direct outreach to program staff, updating 2021 BioCycle data via program websites, and gleaning data for programs started in the past two years from program websites, news articles and other sources. BioCycle also obtained a list of municipally supported residential food waste collection programs started in California since January 1, 2022, when the state’s SB 1383 law went into effect. The law requires jurisdictions to provide residential organics collection services. A total of 450 programs were on CalRecycle’s list; the 2023 BioCycle Access Study reflects data from 105 jurisdictions with a population of 44,000 or greater (based on the 2020 Census).
BioCycle and Part II co-authors Stephanie Motta, data strategist for the Composting Consortium, and Paula Luu, senior director at Closed Loop Partners’ Center for the Circular Economy, conducted a robust quality assurance review to address inconsistencies and anomalies in the residential food waste collection access data set. BioCycle extends a thank you to the municipally supported programs that participated in our 2023 survey.
Defining Access
For the purposes of this study, BioCycle uses this definition of access: “freedom or ability to obtain or make use of something” (Merriam Webster). When applied to residential food waste collection, households that fall within a municipally supported program’s parameters have access.
An example is a municipality that establishes a curbside program to collect food waste from all single-family homes. Each home receives a cart (standard offering), therefore all single-family households have access to residential food waste collection. Another example is a municipality that establishes a drop-off location(s) for household food waste that is open to all households in the community. In this case, all households in that community — single-family and multi-family — have access.
Overall Findings
The 2023 BioCycle Nationwide Survey on Residential Food Waste Collection Access finds robust growth in programs since 2021. We identified a total of 400 programs, encompassing 710 communities. Some programs, e.g., ones managed by a county or solid waste authority, report data for multiple communities. The number of households in the U.S. with access is 14.9 million.
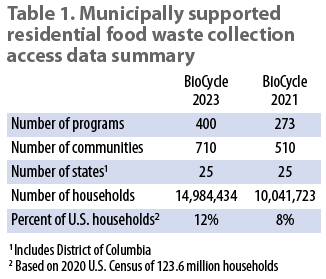
Table 1 compares BioCycle data from the 2021 and 2023 Access Studies. There has been a 47% increase in the number of residential food waste collection programs, a 39% increase in the number of communities with access, and a 49% increase in number of households with access between 2021 and 2023. In addition to the municipally supported collection programs, companies, nonprofits, or worker-owned cooperatives offer residential food waste collection service on a subscription basis — often in locations where municipal programs do not exist. The 2021 BioCycle survey included data from the services that responded. Close to 150 enterprises were contacted and about 50 responded with information. The 2023 survey does not include those enterprises.
Figure 1 tracks the number of households with access since BioCycle formally began its nationwide survey of residential food waste collection programs in the U.S. in 2005. The survey was repeated in 2006, 2007, 2009, 2011, 2012, 2013/’14, 2017, 2021 and now again in 2023. (All survey reports are available on BioCycle.net.) Figure 1 illustrates the gradual rate of adoption of municipally supported programs to collect household food waste. The biggest growth took place between the 2013/2014 and the 2017 Access Studies — a jump from 2.74 million to 11.7 million households with access. The increase was attributed in part to the 3+ year gap in data collection and the roll out of residential food waste collection in New York City in 2016. The City’s program included drop-off sites throughout the five boroughs, providing access to all residents. (Note: 2017 was the first year that BioCycle included drop-off sites in its residential collection access survey.)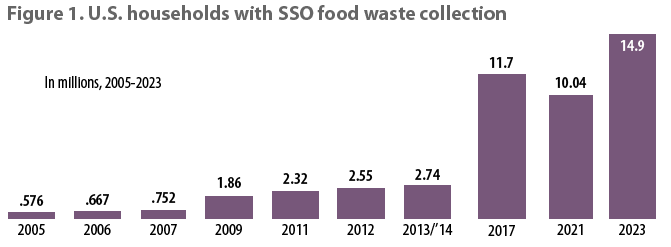
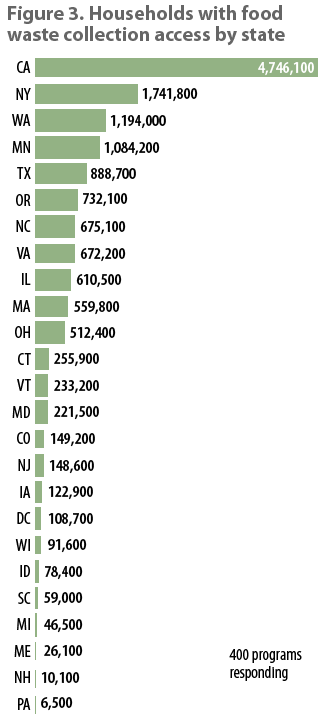
Figure 2 breaks out the number of residential food waste collection access programs by state. California leads the nation (105 programs), followed by Illinois (50), New York (46), Minnesota (42) and Connecticut (30). Together, these five states represent 68% of collection access programs in the U.S. Figure 3 breaks out the number of households with access by state. As noted above, California’s reported number (4.7 million) is based on the 105 programs that BioCycle evaluated, plus those jurisdictions that completed the online survey. The actual number of households with access is greater (based on CalRecycle’s list of 450 jurisdictions providing collection access) but to our knowledge, the state has not calculated the total number of households served by all programs.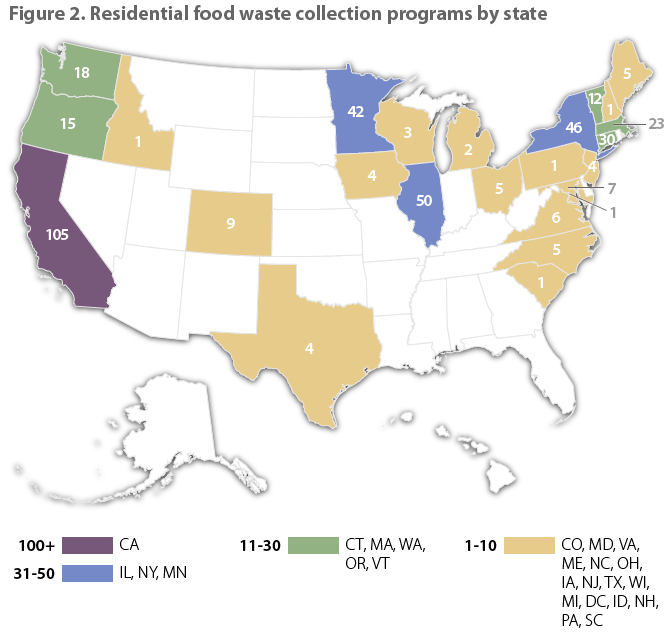
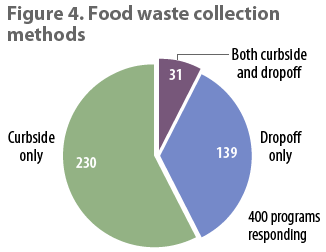
Of the 400 access programs tracked in the 2023 BioCycle Nationwide Access Survey, 230 are curbside only, 139 are drop-off only, and 31 offer residents a combination of curbside and drop-off collection access (Figure 4). New York City, for example, restarted its residential curbside collection program last fall in the Borough of Queens, and plans to roll it out in all five boroughs in 2024. It also offers food waste drop-off collection. Totals for each category are as follows:
- Curbside Only: 230 programs, 321 communities, 8.2 million households with access
- Drop-Off Only: 139 programs, 357 communities, 5.1 million households with access
- Curbside + Drop-Off: 31 programs, 32 communities, 1.8 million households with access
Without a doubt, California’s S.B. 1383 is a key driver to growth in residential food waste collection access programs in the U.S. Vermont is the only other state that mandates diversion of household food waste from disposal. Its jurisdictions and waste service providers have complied primarily by providing drop-off collection sites throughout the state, typically located at solid waste transfer stations and recycling depots. Washington State will be rolling out its requirements for residential food waste collection over the next several years, following passage of H.B. 1799 in 2022. The law requires jurisdictions to establish organics collection services for residential and nonresidential customers, beginning January 1, 2027.
At the local level, only a handful of jurisdictions had local ordinances or mandates stipulating residential access to and/or participation in food waste collection prior to this year’s data collection. Early adopters of mandatory programs were Seattle and San Francisco. More recently, Hennepin County, Minnesota, passed an ordinance requiring all jurisdictions within the county to establish a residential food waste collection program. The ordinance became effective in January 2022. In June 2023, the New York City Council passed a law that makes residential food waste collection mandatory; the Department of Sanitation is in the public comment phase of establishing requirements. In California, under its S.B. 1383 regulations, jurisdictions are required to pass an “enforcement ordinance” that lays out compliance with their residential food waste collection services.
Curbside Programs
Details culled on municipally supported curbside food waste collection programs are highlighted in this section.
Program Scale, Collection Frequency
About 60% (156) of the 256 curbside programs are available to all single-family households in a jurisdiction’s service area (Figure 5). Forty-one programs are seasonal — typically offered from April to November where households have the option of adding food scraps to their yard trimmings cart. Seasonal collection is typically seen in northern climates where little yard trimmings are generated in the winter months.
Out of 199 programs reporting, 189 (95%) collect food waste weekly. Ten offer every other week collection. The majority of programs (107 out of 171 responding to the question) utilize their franchised waste hauler to collect food waste. This is fairly common with programs that allow residents to add food waste to their existing yard trimmings cart. About 40 of the jurisdictions reporting utilize their own vehicles for collection.
Participation Options
Jurisdictions and/or their franchised haulers utilize one of three options to participate in the curbside collection programs:
- Opt-In: Households must sign up for the collection service or register to use the drop-off site(s) to recycle their food waste. In some cases, curbside food waste collection is part of households’ general waste services fee, whether they choose to participate or not.
- Standard Offering: Curbside collection service is offered as part of the municipal solid waste program. Households either can add food scraps to an existing yard trimmings (green waste) cart or are issued a dedicated food scraps cart. Participation is optional.
- Mandatory: Collection is offered along with trash and recycling, and participation is required. A jurisdiction’s ability to enforce participation, especially when food waste is commingled with yard trimmings, can be challenging. For example, if participation is measured by cart set out, the household may only put the organics cart at the curb when it has yard trimmings to recycle.
In 2023, as noted earlier, the number of programs requiring household participation (mandatory) has increased — from 13 in 2021 to 104 in 2023. The number of opt-in programs is 97, and standard offering is 50. It is interesting to note that overall, opt-in programs are used more frequently than standard offering. However, this may be due to a ‘shifting’ of the numbers — from the standard offering column into the mandatory column — as many California jurisdictions were already offering yard waste collection as a standard service and expanded that service to include food waste.
Feedstocks Accepted
All curbside programs accept fruit and vegetables and the majority allow meat, fish and dairy (Figure 6). Out of the 248 reporting, 176 accept soiled paper and pizza boxes and 154 include yard trimmings commingled with food waste. About half (106 programs) allow households to use certified compostable bioplastic liner bags. In terms of other certified compostable products, 56 accept bioplastic foodservice ware, 27 take molded fiber containers and 14 allow bioplastic coated paper (e.g., cups with a bioplastic lining). In California, most of the new curbside food waste collection programs do not accept certified bioplastic liner bags or other compostable packaging. They do allow kraft paper bags and some include food-soiled paper. Anecdotally, the inability to contain the food waste in a bioplastic liner bag can dampen participation due to the yuck factor of adding food waste to a green waste cart that previously had stayed relatively clean.
Food Waste Set Out
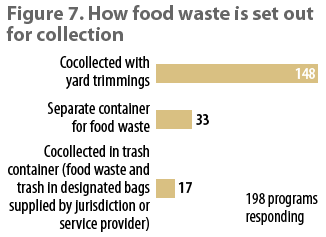
Figure 7 captures how households set out food waste at the curb. As in past surveys, the majority (148 out of 198 reporting) co-collect food waste with yard trimmings. Thirty-three programs collect food waste separately from yard trimmings, and 17 programs collect bagged food waste in the same container as the bagged trash. Some municipalities in Connecticut, for example, are pilot testing co-collection with trash. Households use bags supplied by the cities — an 8-gallon green polyethylene (PE) bag for their food waste and a 12-gallon orange PE bag for their trash — which get separated at a transfer station or similar facility.
Curbside Program Performance
Participation Rate:Of the 85 programs completing the online survey, 45 responded to the question about measuring the household participation rate in the curbside program. Only 16 programs (36%) measure participation and 29 (64%) do not. Of the 16 that measure, six reported that 95% to 100% of households participate; four reported a 40% to 45% rate of participation. Three reported participation was less than 30% and three are between 50% and 85%. Six measure participation by cart set out tracked by the collection crew; five base it on number of subscribers and three base it on households requesting a cart. Only one program reported doing a cart lid ‘flip’ to see if food waste was included with the yard trimmings.
Tons Collected: Programs also were asked about the tons of food waste collected from residents annually. Of the 29 responses, four collect <100 tons/year, seven collect >10,000 tons/year and three collect 200-299 tons/year. Remaining responses were all <1,000 tons/year.
Contamination Rate: Out of 45 programs responding to the question about the rate of contamination in the food waste carts (commingled or set out in a food only cart), 38% (17) do not know the rate of contamination. Eleven programs (24%) report <2% contamination, six report 3% to 5%, and six report 6% to 10%. Three are in the 11% to 15% range. One reported >20% contamination. Twenty-one of the 45 responding quantify contamination via a visual inspection at the transfer station or composting facility tipping area as well as conducting visual examinations of the food waste carts set out at the curb. Nine report doing waste sorts and measuring by weight.
Primary Pain Points: Low participation is the most significant pain point voiced by programs answering this question (28 of 45), followed by contamination (23 of 45). Ten programs cited program costs, five said the cost of the tipping fee at the processing facility and three noted a lack of elected officials’ support. When asked what they are doing to enhance their curbside program’s participation and performance, outreach and education were cited by over 80% of respondents. Most programs are utilizing flyers, door-to-door campaigns and in-person training/classes to increase participation, along with use of social media and digital ads. Of the 45 reporting, 18 were utilizing paid media, e.g., TV and radio ads, billboards and posters on city buses.
Drop-Off Programs
Establishing residential food waste drop-off sites is a relatively low-cost way to provide households with access. As noted above, drop-off sites in Vermont are widespread as a tool to comply with the state’s food waste disposal ban. In Connecticut and Ohio, communities are increasingly using drop-off sites to provide households with access. In Connecticut, a handful of communities have started small-scale composting operations to process the food waste dropped off by residents. Westchester and Putnam counties in the New York metropolitan area continue to build out drop-off locations for their residents.
The 2023 BioCycle Access Study found 141 programs that exclusively offer access via drop-off locations (as well as 29 programs providing curbside and drop-off access). Of the 123 drop-off programs responding, 68 (55%) only have one site in their jurisdiction; these are often small or rural communities. Mid-sized to larger cities may offer multiple drop-off sites, spreading them out across their jurisdiction. The City of Boston, which launched a three-year curbside food waste collection pilot in 2022, has been providing households access to drop-off locations for a few years through its Project Oscar sites. Increasingly, jurisdictions are establishing drop-off sites at community farmers markets.
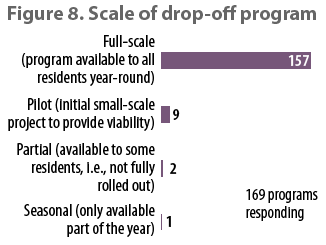
Figure 8 shows the scale of municipally supported drop-off programs. Over 90% of drop-off program respondents service all households (single- and multi-family) in the community and are open year-round. Municipalities may require households to register to use the drop-off sites; in some cases, the bins can only be accessed using a code provided when residents register. Only a small percentage of programs surveyed charge a fee (typically a flat, annual fee) to use the food waste drop-off site.
In terms of hours when the drop-off sites are open, 64 programs responded: 30 are open the same hours as the transfer station or recycling depot where the drop-off is located, 11 are open set days and hours, 10 provide 24 hours/day access with the bins unlocked, and 10 offer 24 hours/day access but a key, passcode or tag reader is required. Of the 62 programs responding to a question about staffing, 36 staff their drop-off sites, 23 do not, and 3 do sometimes.
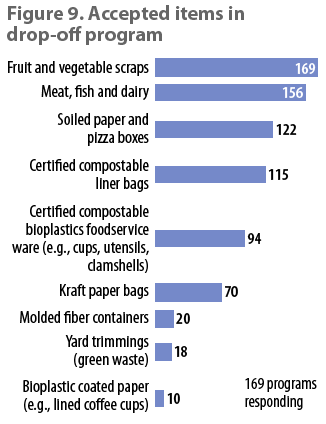
Figure 9 lists the feedstocks accepted at the drop-off sites. Many programs do not accept yard trimmings to preserve space in the drop-off carts and because the jurisdiction likely has other means of collecting yard trimmings. There is a fairly stark difference between drop-off and curbside programs in terms of acceptance of compostable liner bags and compostable bioplastic foodservice ware, which is discussed in the next section. Types of food waste collected and acceptance of soiled paper and pizza boxes are similar between curbside and drop-off programs.
Compostable Packaging Acceptance
Figure 10 illustrates the difference between acceptance of compostable food-contact packaging between curbside and drop-off programs. Of 261 curbside programs responding, 145 (56%) do not accept compostable packaging versus 31% of drop-off programs. Conversely, 71% of curbside programs and 72% of drop-off accept soiled paper and pizza boxes. That is where the similarities end, as illustrated in Table 2.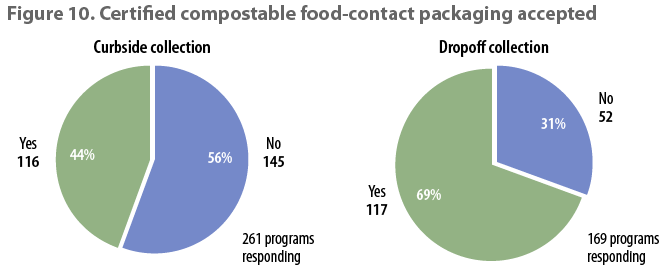
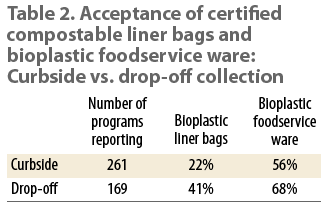
One possible explanation for the lower curbside acceptance is the fact that California accounts for 40% (105 out of 261) of the curbside programs reported in the U.S. As noted earlier, many of the new programs started after S.B. 1383 became effective in the state do not accept liner bags nor bioplastic foodservice ware, but many do accept soiled paper and pizza boxes.
The Access Survey asked why programs did not accept compostable food-contact packaging such as foodservice ware ( a ‘check all that apply’ question). A total of 19 curbside and 20 drop-off programs responded (reason and number of responses for each):
- Composting facility processing collected food waste does not accept any certified compostable bioplastics, including liner bags and foodservice ware: 29
- Contamination from lookalike single-use plastic packaging and film plastic bags: 27
- Composting facility processing collected food waste does not accept any certified compostable molded fiber containers: 22
- Product labeling insufficient to ensure packaging is certified compostable: 17
- Potential for PFAS contamination: 14
- Composting facility doesn’t accept compostable bioplastic packaging but does accept compostable bioplastic liners bags: 4
Takeaways
The 2023 BioCycle Residential Food Waste Collection Access Survey reflects a snapshot in time of municipally supported programs around the U.S. Since BioCycle’s data gathering was completed in June, we continue to learn about new residential curbside and drop-off food waste collection programs. The process of gathering and analyzing data about residential food waste collection access in the U.S. has led to a variety of insights, including:
- Significant Growth in Access: The number of households in the U.S. with access to food waste collection has increased by 49% since 2021, from 10.0 million to 14.9 million households, indicating a substantial expansion of residential food waste collection programs nationwide.
- Challenges in Participation: Low participation rates and contamination issues continue to pose significant challenges for food waste collection programs, with variations in participation rates and difficulties in enforcing participation requirements. Program performance measurement is more effective when it is integrated into collection contracts, as seen in initiatives such as the City of Boston (MA) pilot and Upper Arlington (OH) pilot, where the hauler is responsible for tracking participation and reporting that information to the city. Factors such as program design, opt-in vs. mandatory participation, and the “yuck factor” in commingled collection of food waste and yard trimmings when a compostable liner bag cannot be used, play a role in participation levels.
- Motivation Matters: The motive behind collecting food waste can significantly impact a program’s success. When integrated into a broader climate action plan or driven by a strong commitment to organic waste recovery, jurisdictions tend to invest more in boosting participation and measuring food waste diversion. However, programs initiated merely to check a compliance box may not prioritize increasing food waste diversion efforts.
- Acceptance of Compostable Packaging: Many food waste collection programs do not accept compostable food-contact packaging due to concerns about contamination, product labeling, and potential PFAS contamination, highlighting challenges in incorporating such packaging into existing programs.
- Drop-Off and Backyard Composting Comparison: Drop-off programs for food waste often attract enthusiasts and households seeking convenience, similar to backyard composting. Participation typically plateaus after an initial uptake by enthusiasts and those who participate due to convenience. Mandatory drop-off programs, as observed in Vermont, may exhibit different dynamics.
Programs by city/state
Curbside and Drop-Off
Curbside Only
Drop-Off Only
In summary, BioCycle data reflects steady growth in the number of households in the U.S. with access to food waste collection. New York City’s new law that makes residential collection of food waste mandatory will significantly boost the number of households in the U.S. with access, along with continued implementation of collection programs in California to comply with the state’s S.B. 1383 climate pollutant reduction law.
Going forward, anchoring municipally supported food waste recycling into local Climate Action Plans as a landfill methane avoidance tool is strategically important. It is a motivator to both encourage participation and measure what is being collected.
Nora Goldstein is Editor of BioCycle, and has been conducting food waste-related surveys since the mid-1990s. Paula Luu is a Senior Project Director at Closed Loop Partners. She leads the firm’s Composting Consortium, which works closely with brands, composters and other key stakeholders to gather data that can inform the best path forward and drive value across the composting system. Stephanie Motta is a Data Strategist for Closed Loop Partners’ Composting Consortium. Additionally, she leverages her recent MBA by actively contributing her expertise as a sustainable business consultant, empowering organizations towards ESG-focused practices.
